
How To Draw The Full Wave Rectifier Waveform Using MATLAB Simulink
In previous matlab tutorial post, we have learned, How to do natural sampling using MATLAB Simulink. Now in Post-05 of Module-II, we will create the simulation to draw the full wave rectifier waveform.

To create the simulation for this, Drag three blocks i.e. Sine Wave under sources, Scope under sinks and Abs under math operations from simulink library browser to new model file and connect it as shown in figure-1.
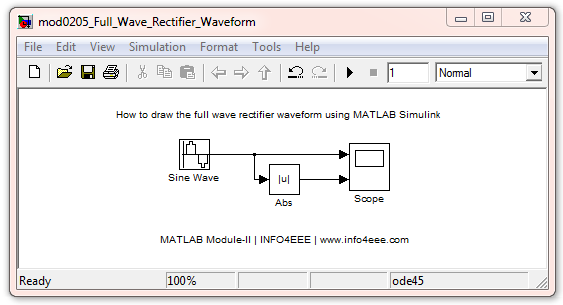
Figure.1 - Simulation Model to draw the Full Wave Rectifier Waveform
Sine wave block parameters are selected as 10 amplitude, 10*pi radian per second frequency, 0 radian phase and 1 micro second sampling time. Screen capture of parameter box is shown in figure-2.

Figure.2 - Parameter selection of Sine wave block.
Abs block parameter are as 1 micro second sampling time. Screen capture of parameter selection of abs block has been shown in figure-3.

Figure.3 - Parameter Selection of Abs block
Remember one important thing that sampling time of all the block should be same. Now after selecting all the parameters, run the simulation after clicking on start simulation button. Output generated using this simulation has been shown in figure-4.

Figure.4 - Scope Output
First waveform of sine is an input and second waveform of full wave rectifier is an output of the simulation.


Post a Comment